China’s Shocking Worldwide Economic Dominance Revealed
China’s productive economy is now 3x the size of the US.
View from China with an Austrian School of Economics Perspective
Comparing countries is a challenging task, because to do so necessarily requires the use of statistics coming from multiple sources. Even if these sources are allegedly applying the same criteria, in reality we know that this is an approximation at best.
One way of doing this is to use hard statistics from various industries, like car registrations, electricity usage or shipping numbers. This is usually fairly objective and not so easy to fudge on purpose.
All of the above do give us an idea of the real size of China’s economy in worldwide comparison. We covered car registrations here:
Top Ten Myths About China - Part 2
The upshot: Annual registrations of passenger cars in China are about six times the number in India, which is the second largest market, followed by Japan, the USA, Germany, the UK, Brazil, France, South Korea and Italy.
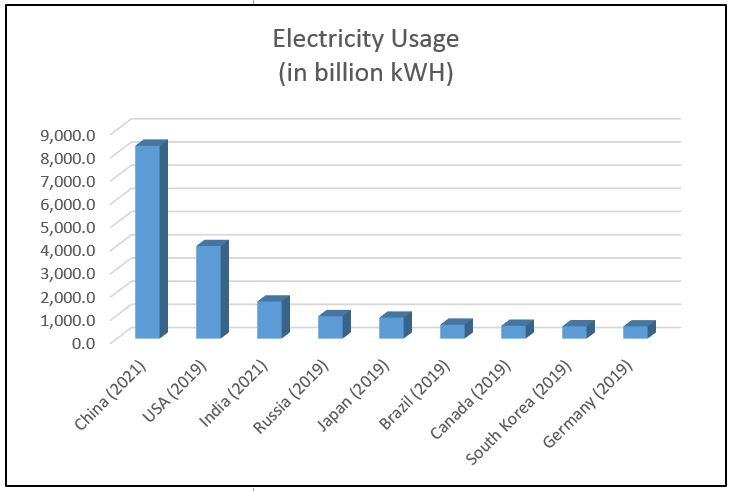
If we look at electricity usage by contrast, the list and proportions look a bit different. There we see:
The USA is here the clear #2, with usage about half of China’s level.
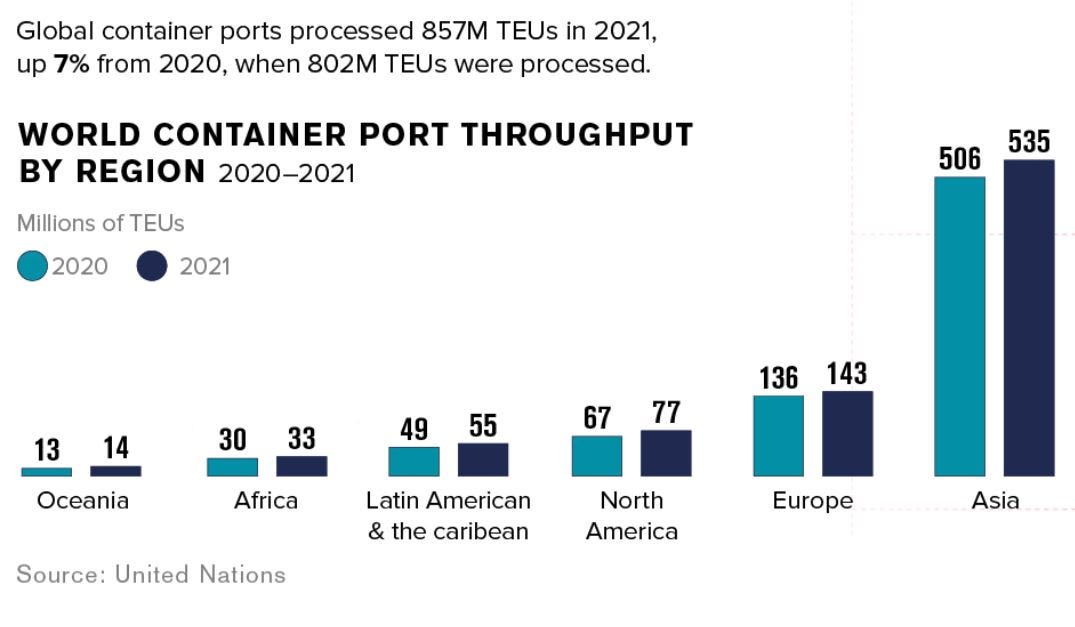
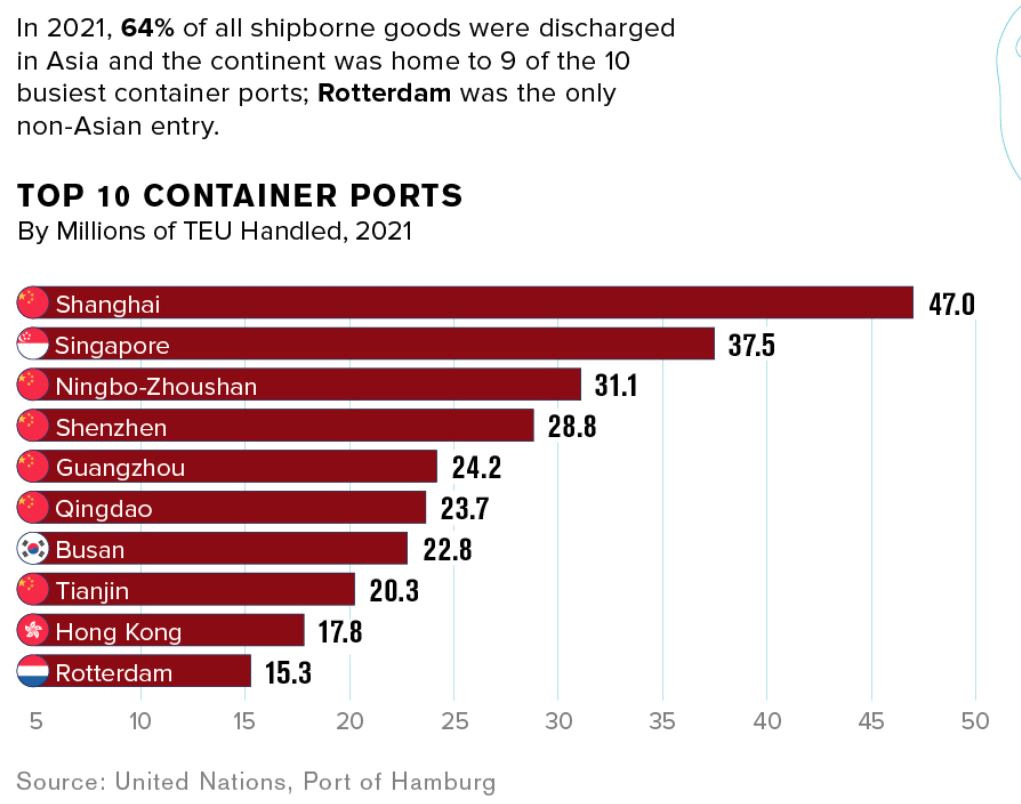
What about shipping?
Here we see an overwhelming dominance of Asia, and most especially Chinese ports, which make up eight out of the top 10 worldwide. Seven of the top 10 are in China.
With these statistics in mind, let’s finally take a look at the elephant in the room: GDP. To be clear: the concept of “GDP” (gross domestic product) is indeed a flawed concept – a mish-mash of apples and oranges, many of which arguably reflect questionable value. Nonetheless, we would argue that as we don’t have anything better as a basis for discussion, these numbers despite their problems can provide us with useful insights.
Let’s look at some of those insights.
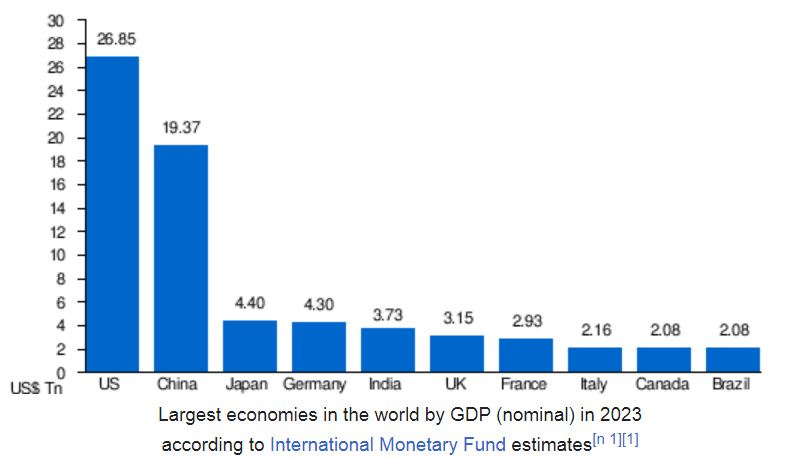
The following table ranks countries by estimated nominal GDP according to numbers provided by the International Monetary Fund in April 2023. The table uses current official exchange rates, which of course do not reflect actual purchasing power. For many it will look familiar, with the USA ranked #1, China #2, then followed after a substantial gap by Japan, Germany and India. Several other Western European countries make up the Top 10. Russia and Indonesia aren’t on it.
There are however of course other ways to do this comparison. One of the most common ones is to come up with an exchange rate which more accurately reflects actual purchasing power, what is conventionally called “purchasing power parity” (PPP). As Wikipedia explains it, purchasing power parity is a measurement of the price of specific goods in different countries. It is used to compare the absolute purchasing power of various countries' currencies. PPP is effectively the ratio of the price of a basket of goods at one location divided by the price of the basket of goods at a different location.
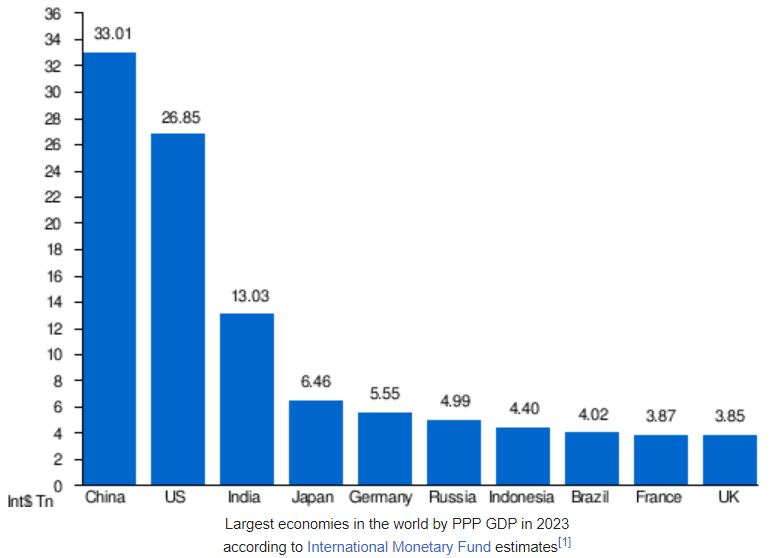
Here’s what that table looks like, again using the 2023 estimates provided by the IMF:
This chart obviously looks a bit different, with China as the clear world leader, Russia at #6 and Indonesia at #7.
However, there is a third way to play with the available numbers, and that is to exclude the so-called “service sector” from the calculation. These numbers tell us how much STUFF countries are producing – in other words, tradable goods. While this arguably does exclude productive sectors of the economy such as transportation and logistics services, is also excludes GDP components of more questionable value, such as so-called financial services, insurance and the like.
Here’s what that looks like using the same source. Estimates for the service sector size are drawn from the CIA World Factbook.
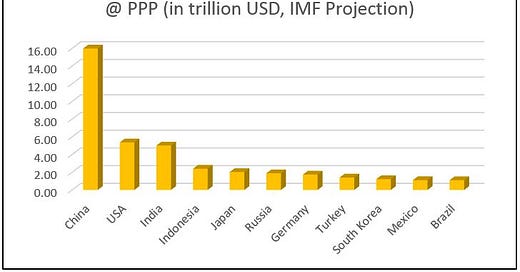
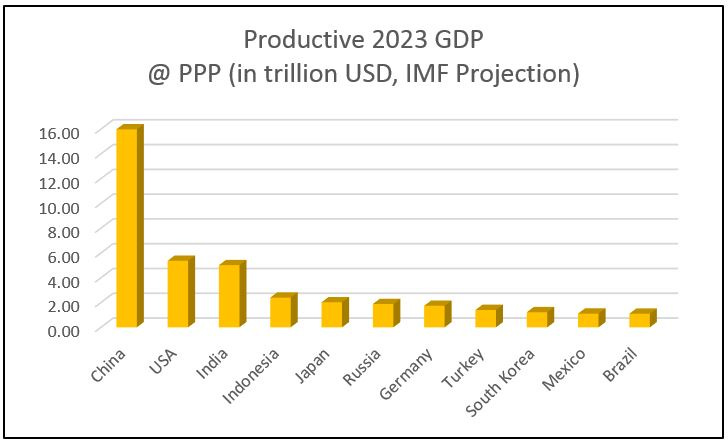
Or as a bar chart:
Here by contrast we see a completely different table. We provided the Top 11 because Brazil and Mexico are not meaningfully different. The most striking point is of course that China’s Productive GDP is about three times the size of the US Productive GDP. Second, note that the UK and France are gone. Third, note that Indonesia moves up from #7 to #4, ahead of Japan. Russia remains at #6, ahead of Germany. Fourth, we see Turkey at #8, a country which does not show up on any of the previous tables. For centuries Istanbul/Constantinople and Moscow have been the two largest cities in Europe, so this should actually not be surprising. But it is a fact often forgotten.
If we look at the per capita numbers, perhaps the most surprising aspect is how many countries have per capita productive GDP numbers in a fairly similar range, namely between ten and twenty thousand USD. Among these, South Korea stands out as the most productive economy in the top 11, with Germany following several thousand dollars behind; yet the differences are not huge. Moreover, despite its enormous population, China has a per capita productive GDP of 71.5% of the US level.
Some numbers worth thinking about.
Follow us on Twitter @AustrianChina.



Credit is due to unz.com and in particular Ron Unz for providing the inspiration for this post. The following article explains the concept of Productive GDP and why it's an important part of understanding today's geopolitical tensions:
https://www.unz.com/runz/china-america-and-the-economist
Thanks to Brazil's Instituto Rothbard for posting a Portuguese translation:
https://rothbardbrasil.com/revelada-a-chocante-dominancia-economica-mundial-da-china/