Anatomy of a Squeeze
Cryptocurrency and Western stock markets could be on the brink of another major move down.
View from China with an Austrian School of Economics Perspective
Those who followed our lead and invested in Chinese e-commerce stocks like Meituan or Alibaba in late May did well. Alibaba rose over 30%, the YINN index rose 57% from May 24th to June 8th, and Meituan rose by 37% from May 26th to June 8th. Though these stocks have all corrected somewhat over the past week following the US lead, overall they still remain in the black. It seems that the Chinese business community hasn’t quite given up hope yet.
But what about the broader market? Those who bought US blue chips around the same time did less well. Those who bought Apple on May 26th lost about 8% thus far. During the same period, the S&P is down about 6%. More importantly, this past Monday the S&P once again broke through the key downside resistance level of 3,900 points, which was the prior 2022 bottom hit on May 19th. Was there any leading indicator which could have tipped investors off as what was likely to happen on Monday morning?
Yes. There were at least two. One was the fact that bitcoin, which in terms of trend direction these days tends to correlate closely with the US stock markets, broke down over the weekend, leaving its prior trading range between $26,000 and $31,000. It’s now hovering just over the historically critical support level of $20,000.
Since the primary impulses driving crypto markets moved from Asia to the United States, major movements in the crypto markets tend to happen during US trading hours, meaning that typically not much happens on the weekends. This past weekend was a major outlier. That was already a big tip that a stock market break to the downside could also be in the works. The other leading indicator was of course the falling prices on the Hong Kong market earlier on the same day.
That’s all very nice, one might say, but what does that tell us about the future?
Perhaps quite a bit.
To see why, let’s look at the bigger picture.
US Money Supply Expansion Drives Asset Price Bubbles
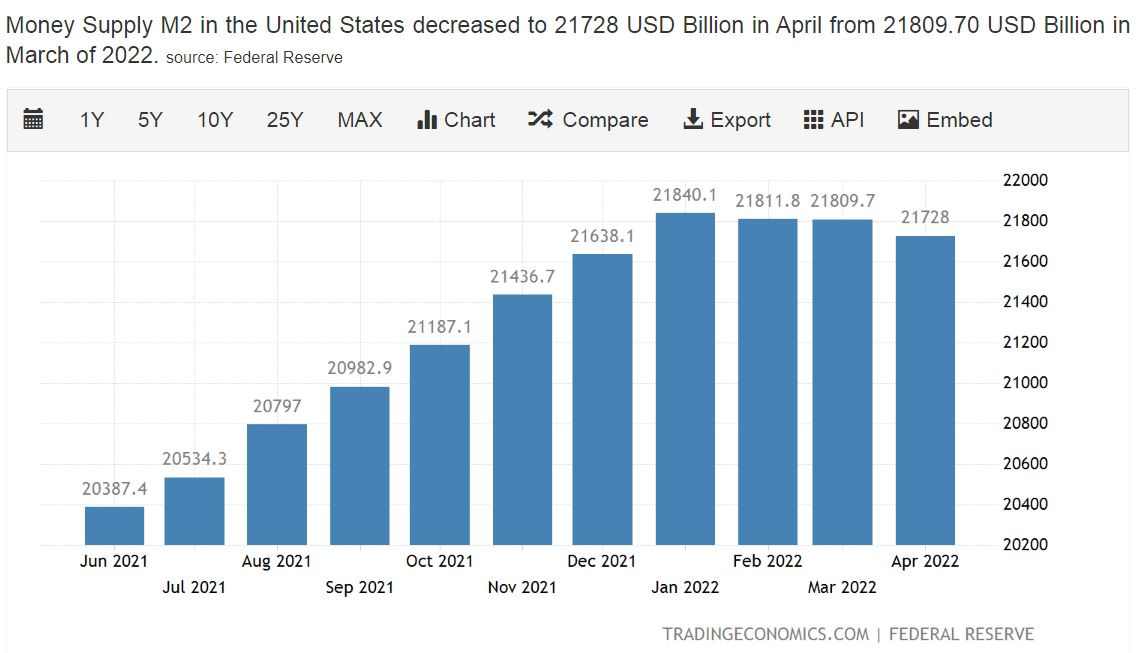
The US M2 money supply rose by about 40% between January 2020 and December 2021, before finally reversing course in January 2022.
As usual, the initial effect was an increase in certain asset prices. Broad-based inflation of consumer prices followed with a substantial delay. In 2021, three major destinations for these newly printed funds were the stock markets, cryptocurrencies and real estate. Thus despite massive economic disruptions, the S&P stock market still rose by approximately 47%. During the same period, bitcoin rose from $29,000 to $69,000, an increase of ~138%. Ethereum rose from $738 to $4,630, a rise of over 500%.
What happened to US M2 since December 2021? Remarkably, it has actually fallen. Not by much, by in today’s inflationary times, such a sustained tightening of the money supply is highly significant.
[As a point of comparison, China’s M2 Money Supply rose by approximately 20% during the same period, but unlike the US, has continued to expand at approximately the rate 10% annual rate in 2022.]
Both the cryptocurrency and stock markets responded as one might expect: The 2021 bubble popped and they fell. While the fall in the US stock market since its peak in December 2021 has been substantial, it has just entered bear market territory (-20%) and there could still be a long way to go down. Bitcoin is down by 70% and is now under its level at the outset of 2021.
The correlation between this tightening and the price collapses in the prices for asset classes which rose sharply in 2021 is obvious. These specifically include the crypto markets as well as the stock markets, though less so the commodity and precious metals markets.
So if crypto prices can act as a leading indicator for US equity market trends, what are the prospects for further price development on the crypto markets?
To answer that question, first we need to take a step back and take a look at what drives the financial markets.
What drives the financial markets?
“We are either dealing with extremely stupid people who don't understand how anything works and who keep ruining everything by accident, or we are dealing with extremely sinister people who know full well how things work and nothing is happening by accident. I don't particularly relish either scenario, but the second one is looking increasingly likely.” (Tom Woods on June 14, 2022)
Alas, we do not live in a world of honest money. Instead, we live in a world where financial markets are highly manipulated by those who print the new fiat money and those who get it. Those closest to the printing press tend to profit from this arrangement, while those farther away tend to be on the losing side. New funds do not flow evenly into asset classes, so discerning which asset classes are in favor at any given point in time is a crucial skill for playing the asset management game.
The crypto markets are no exception to this – they are just as much fueled by the printing presses as any other. In fact, since there is nothing real at all underlying the crypto markets, unlike say in the gold market, there is literally nothing in the real world which could put a limit on their upsides or downsides. This makes crypto especially attractive.
If you were told in school that most public markets are “too big” to be manipulated – this is a complete fiction that many a long term market participant can disabuse you of. One of the oldest and most common techniques used by large market makers to profit from market movements is to squeeze out market participants who have used leverage to purchase assets. It doesn’t matter what type of asset – fiat currencies, cryptocurrencies, commodities or stocks. It’s the “dump” part of the pump & dump game that Thomas Lawson described so aptly in his 1906 classic Frenzied Finance. Market makers shorting the market profit by forcing overleveraged holders to sell at a loss.
In retrospect this often shows up on the charts as a flash crash or (in the case of a short squeeze) as a short-lived spike to the upside. Large open positions bought on margin are an open invitation to market makers to extract profit. This is especially the case when the market maker has access to exchange information, when the liquidation price points are either in the public domain or when they can be guessed at.
This is not a moral judgment. It’s just a fact. Understanding this is a crucial component in making profitable investment decisions.
Cascading Liquidations
As asset prices across the cryptocurrency markets have fallen, a number of under collateralized schemes have broken down. Perhaps the most prominent of these was the LUNA/UST debacle. UST was promoted as a US dollar pegged stablecoin backed by a smart contract controlling large amounts of crypto collateral and offering high interest rates for staked coins. As the values of that collateral crumbled, this obvious flaw led UST to collapse, as well. It lost its peg to the US dollar on May 9th and is now trading under 1 US cent. Was this just an inevitable consequence of a flawed financial structure? Or an intentional takedown from which certain parties profited? Either way, we can be sure there were a few winners and a lot of losers.
This past weekend we saw another major takedown along similar lines, namely the Celsius staking and lending platform. Revelations of alleged asset losses dating back to 2021 led to a run on deposits held at Celsius. On Monday June 13th, Celsius announced that it was suspending all withdrawals and even internal transfers. While this does not necessarily imply that Celsius is bankrupt, it does mean that its depositors are unable to use their balances to shore up collateral backing open margin positions.
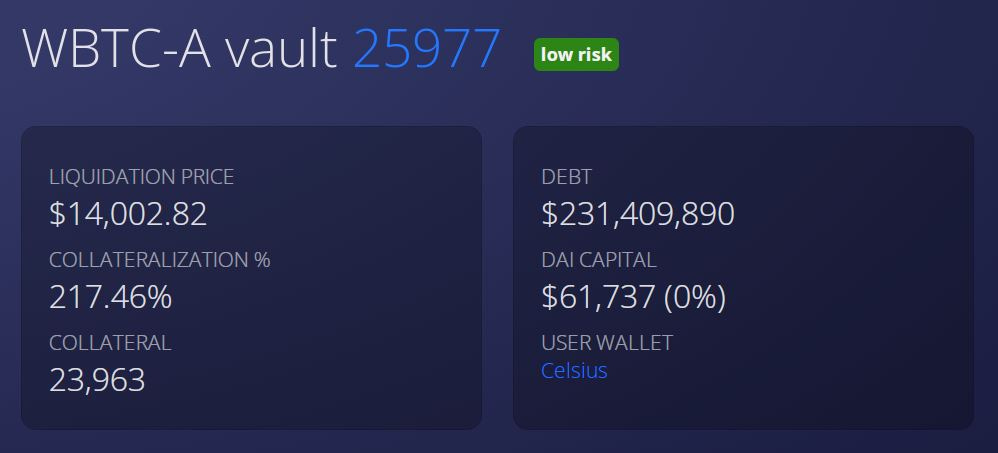
For one thing, Celsius itself has an open loan of USD 278 million backed by 23,963 BTC. According to blockanalitica.com, the current liquidation price level for this is USD 14,002.82. Substantial additional collateral was put up in the past week to shore this up. If bitcoin were to touch this level, even very briefly, liquidation would be triggered. The fact that Celsius keeps adding to its collateral hints that its management clearly considers such a scenario to be a realistic possibility.
Celsius is not alone in holding precarious long positions.
Other Defi platforms also saw major liquidations over the past few days, including one forced market sell of 65,000 ETH on Uniswap, pushing the ETH price briefly from ~$1,200 to around $950.
Tron’s stablecoin USDD has also slipped from its peg.
Another potential deleveraging candidate is the well-known Blackrock-invested crypto fund MicroStrategy.
According to a report by Fortune Magazine on May 13th:
"In March, MicroStrategy borrowed $205 million from Silvergate Bank, using Bitcoin as collateral to buy more Bitcoin. In the first quarter, MicroStrategy bought $215 million of Bitcoin at an average price of $44,645 per coin [= approximately 4815 bitcoins]. If the price of Bitcoin drops below $21,000, the company will face a margin call that will force it to pay up more cryptocurrency to back its loan with Silvergate. However, MicroStrategy’s CFO Phong Le said on the company’s first-quarter earnings call that it still has uncollateralized Bitcoin that it can put up."
Given the deep pockets of MicroStrategy’s backers, perhaps it’s not the best candidate for a long squeeze. But it’s one of them and certainly could already be reducing its position via OTC sales. High levels of OTC sales hint that some major players are indeed reducing their positions.
Retail investors on the other hand are always the preferred candidate for a squeeze. In this case the cryptocurrency markets have quite a few of these.
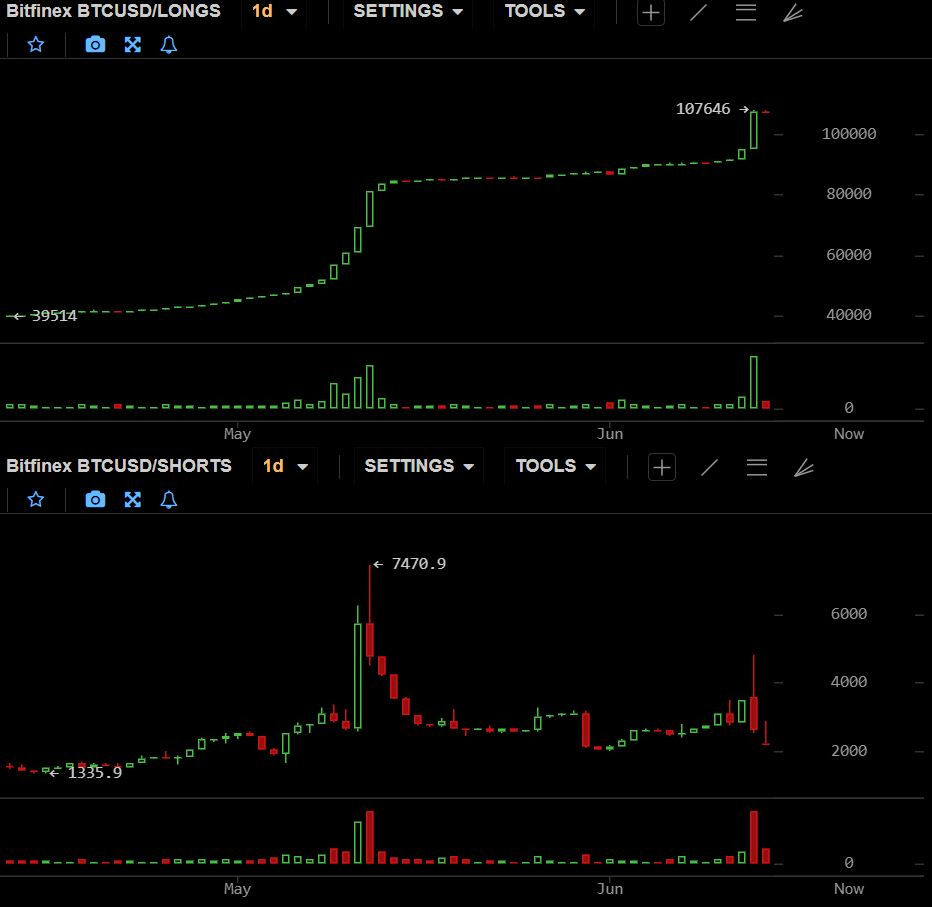
If we look for example at the long positions currently held on Bitfinex, one of the leading cryptocurrency platforms, we can see that speculators have accumulated over 107,000 bitcoins using margin, of which over half were accumulated in early May at prices around $30,000. At current prices, these have a value of around $2.4 billion. Most of these positions are now down at least 30%. With bitcoin falling today close to the critical $20,000 mark some such liquidations have already taken place. As those losses get closer to the 40% range, forced liquidations will accelerate. But to trigger the liquidation cascade scenario, the price will have to go significantly lower.
Remember, this number just reflects the situation on ONE exchange, albeit an important one. The total number of coins held in long positions on all exchanges is doubtless far higher.
With the US stock markets now down by over 20%, a similar scenario holds there, as well. Substantial numbers of traders use some margin, and all of these positions are subject to forced liquidation in case of a sudden spike down in prices.
Once significant numbers of liquidations do take place, the liquidation process tends to be self-sustaining, with the initial liquidations pushing the market ever lower and thereby triggering yet more liquidations at lower price points.
Beware the Fed on June 15th (US Time)
So when is this likely to happen?
If/when such a bitcoin market meltdown comes, it seems highly likely that the US stock markets will move in tandem, though by less in percentage terms. What could trigger, or be used to justify such a move? One possible justification could be a “substantial” interest rate hike on the part of the US Federal Reserve, something which could well happen on Wednesday.
According to a report published today, “a Fed spokesperson confirmed the meeting of the policy-setting Federal Open Market Committee began as scheduled at 1500 GMT. Markets will get the rate decision on Wednesday at 1800 GMT.”
What counts as substantial? Whatever the financial press declares to be substantial.
Keep in mind that even the anticipation of such a decision is sometimes used to justify a major move.
In theory higher interest rates make competing assets such as stocks less attractive, but in reality the effect is more psychological than real. Either way, any move can provide a useful public justification for events.
Some things in the pipeline
No downturn lasts forever.
While predicting market bottoms is an arcane science, it’s less difficult to predict the effect of certain kinds of news.
One “event” with the potential for having a high impact would be the announcement of ceasefire talks between Russia and Ukraine. While interest rate hikes can be predicted to push markets down, given the connection between the sanctions against Russia and the high energy prices dragging down many Western economies, ceasefire talks between Ukraine and Russia can be reasonably counted on to have the opposite effect.
Note that such a ceasefire need not actually ever even take place or be agreed to for the announcement of talks to affect the markets. Though Ukrainian President Zelensky recently reaffirmed his determination to reconquer lost territory, multiple opinion pieces in major Western media hint that this ambition may no longer enjoy Western backing. If we grant a grace period of a 1-2 weeks for the memory of Zelensky’s fanciful quip to fade, that gives us a probable time frame of at least one week from now before that point in time comes. Regardless of the exact date, it is hard to see how Ukrainian forces can sustain their current levels of daily losses for more than a month.
While it’s never possible to be certain how any particular piece of “news” will affect the market, the announcement of ceasefire talks would certainly provide a useful cover to justify a rebound.
A second “event” to watch out for is a resumption of Federal Reserve money printing. Given that there is no sign of any change in US government spending patterns, it is hard to imagine that the Federal Reserve can avoid restarting the printing press for much longer. When that does happen, the retrenchment of financial markets we have witnessed in the first half of 2022 is likely to end, as well.
Short-Term Action Plan
If you have exposed positions in Western stock markets or in the cryptocurrency markets, then make sure that your collateral is sufficient to prevent you from becoming a victim of forced liquidation.
If on the other hand you have dry powder in place, this could be a great opportunity to pick up assets at fire sale prices. Just note that you will probably need to have your buy orders in place, since the final downward spike may not give you much time to react. How low can bitcoin go? Historically, anything more than an 80% correction would be unprecedented, which translates into approximately $13,800. That level would indeed be sufficient to take force-liquidate Celsius, at least based on its current levels of collateral.
But even if that does eventually happen, it need not happen in the near future. Even a takedown to levels around $18,000 can be expected to generate substantial liquidations. Celsius’ moves to shore up its collateral hint that its managers consider that a near-term fall below the $17,000 level is by no means out of the question. Yet regardless of where the market does bottom out, at the end of the day, remember that attempting to guess the bottom is rarely a reliable path to success. The path to profiting from massive market volatility is to buy the spike down and wait for the rebound. In light of the correlation between cryptocurrency and equities markets, similar timing may also turn out to be a good one for stock buys.


Update: Bitcoin responded the 75 bps rate increase announced by the Fed by dipping back down to $20K and then rebounding by 15% - an unsatisfying result for the liquidation hunters, but also an unconvincing rebound. The US stock markets more or less did the same thing. Will they give up? Or try again?
Bloomberg just ran an article with the headline: "Tesla, MicroStrategy, Ark ETF Need to Capitulate Before Stocks Bottom"
https://archive.vn/brUep